System Components
1.1 System Architecture
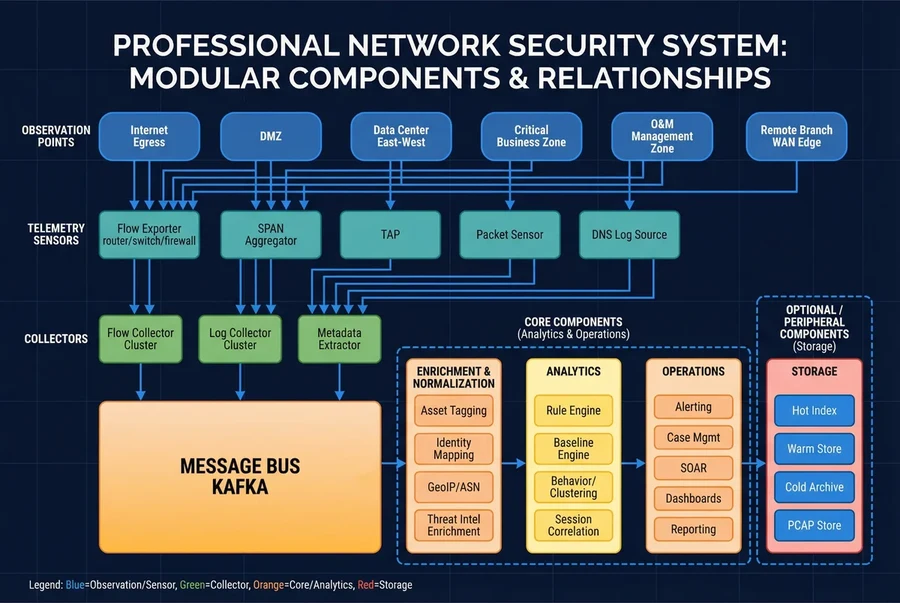
The NTA/AD system is organized as a layered, modular architecture that separates observation, collection, transport, enrichment, analytics, and operations into distinct tiers. This separation enables independent scaling, failure isolation, and technology substitution at each layer without disrupting the overall pipeline. The architecture enforces a clear boundary between the core mandatory components — which must be present for any deployment to be operationally viable — and optional enhancements that add depth at higher cost and complexity.
Observation points are the physical or logical locations where telemetry is generated or mirrored. Each observation point connects to one or more telemetry sensors, which in turn feed into collectors. Collectors normalize and buffer data before publishing to a message bus, which decouples the high-throughput ingest path from the analytics workloads. Enrichment services annotate events with asset context, identity mappings, and threat intelligence before events reach the detection engines. The operations layer provides the human-facing interfaces for alert triage, case management, response actions, and KPI reporting.
Core vs. Optional Boundaries
The core boundary encompasses flow ingestion from NetFlow/IPFIX/sFlow exporters, DNS and TLS metadata collection (at minimum DNS plus TLS SNI), firewall session logs, enrichment services for asset tagging and identity mapping, correlation and alerting engines, dashboards, and KPI tracking. These components must be present and operational before any detection tuning or advanced analytics can be meaningful.
The optional boundary includes full packet capture on limited high-value links, advanced UEBA and graph analytics, SOAR orchestration for automated response, extended long-term cold archive beyond 180 days, and deception signals such as honeypots and canary tokens. These components enhance the system's depth and automation but are not prerequisites for baseline operational effectiveness.
1.2 Components and Functions
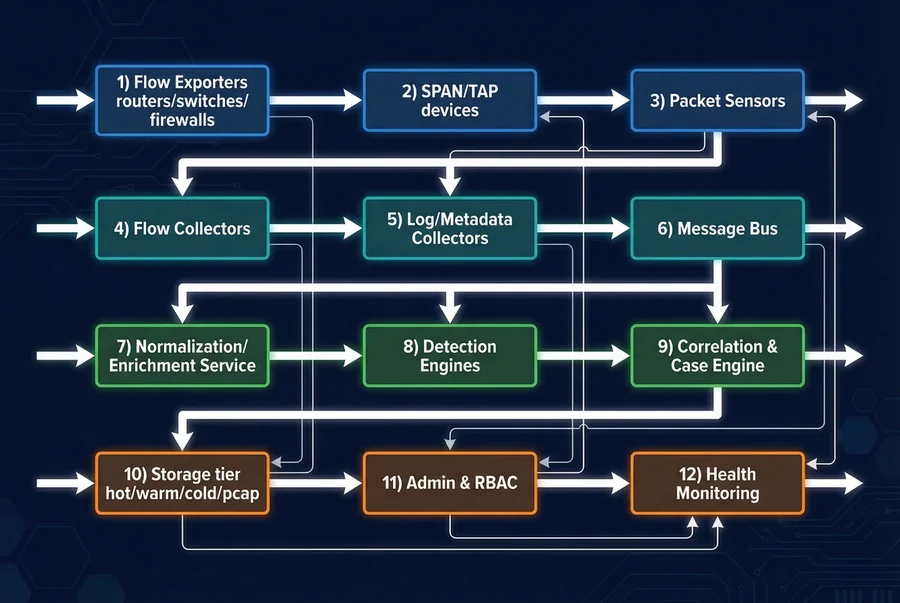
Each component in the NTA/AD architecture has a defined primary responsibility, specific inputs and outputs, measurable KPIs, and a risk profile that describes what happens when the component is undersized or misconfigured. Understanding these relationships is essential for capacity planning, acceptance testing, and troubleshooting. The table below presents the complete component inventory with quantitative targets that serve as both design constraints and operational acceptance criteria.
| Component | Primary Responsibility | Input | Output | Key KPIs (Target) | Mismatch Risk if Undersized/Misfit |
|---|---|---|---|---|---|
| Flow Exporter (NetFlow/IPFIX/sFlow) | Export flow records for all sessions passing through the device | L2/L3/L4 traffic statistics | Flow records to collector | Export loss <0.5%, clock drift <50ms | Blind spots, wrong baselines, missed exfiltration patterns |
| SPAN/TAP | Provide mirrored packet copies to sensors without impacting production traffic | Live production traffic | Mirror feed to packet sensor | Packet loss <1% sustained on mirror | False anomalies from drops, missing payload evidence |
| Packet Sensor | Extract metadata (DNS/HTTP/TLS) and optionally capture PCAP on trigger | Mirror feed from TAP/SPAN | DNS/HTTP/TLS metadata, PCAP index | Sustained capture at target rate; drop <2% | Missing C2 artifacts, poor forensic evidence quality |
| Flow Collector Cluster | Ingest, deduplicate, and store flow records with HA and backpressure handling | Flow records from exporters | Normalized flow events to bus | Ingest headroom 30%, lag <5s | Backpressure, delayed alerts, event loss during peaks |
| Log/Metadata Collector | Ingest DNS, firewall, proxy, and identity logs via Syslog/API | Syslog/API log streams | Parsed events to bus | Parse success >99.5% | Gaps in identity or domain visibility, broken correlation |
| Message Bus (Kafka) | Buffer and decouple high-throughput ingest from analytics consumers | Events from all collectors | Topic streams to consumers | Retention ≥24h, ISR healthy, no topic lag | Data loss during collector or analytics outages |
| Enrichment Service | Annotate events with asset tags, identity mappings, GeoIP/ASN, and TI context | Raw events + CMDB + AD + TI feeds | Enriched events to detection engines | Enrichment latency <2s, coverage >95% | No risk-aware correlation, noisy undifferentiated alerts |
| Detection Engines | Apply rule, baseline, and behavioral models to enriched events | Enriched event streams | Alerts with scores and evidence pointers | MTTD improvement; FP rate manageable (<5%) | SOC overload from noise or missed attacks from blind models |
| Correlation & Case Engine | Build evidence chains and incident timelines from related alerts | Alerts + raw events + enrichment | Case records, incident graphs | Case build <30s, evidence reproducible | Slow triage, weak attribution, analyst fatigue |
| Storage (Hot/Warm/Cold) | Provide tiered searchable retention for events, metadata, and PCAP | Events and PCAP from all pipelines | Query results for investigation | Hot query p95 <3s, retention met per tier | Unusable investigations, compliance gaps, slow SOC |
| Admin & RBAC | Enforce least-privilege access, MFA, and immutable audit logging | Identity provider, role definitions | Access permissions, audit records | Audit completeness 100%, no unauthorized access | Unauthorized data access, compliance failure |
| Health Monitoring | Self-observability for all pipeline components with alerting to NOC/SOC | Metrics from all components | Health alerts, dashboards | Sensor uptime >99.9%, silent failure detection | Silent failures create undetected blind spots |
1.3 Working Principles
Startup Flow
System initialization follows a strict sequence to ensure that each layer is validated before the next depends on it. Sensors first validate NTP synchronization to confirm that timestamps will be accurate for correlation. Collectors then establish ingestion pipelines and validate schema registry compatibility. Enrichment services warm up their caches by loading the CMDB asset inventory and initializing threat intelligence feeds. The baseline learning window then begins — typically 7 to 14 days — during which the system accumulates statistical profiles for each observation point, asset group, and protocol. Rule-based detections are active immediately from day one, providing coverage before baselines mature.
Normal Operation Loop
During steady-state operations, every event follows the pipeline: ingest → normalize → enrich → detect → correlate → prioritize → ticket/SOAR → response action → close → tune. This loop is continuous and parallel across millions of events per second. The enrichment step is critical because it transforms raw network observations into risk-contextualized intelligence — the same anomaly on a critical payment server warrants a different response than the same anomaly on a test workstation.
Abnormal Conditions and Recovery
The system is designed to degrade gracefully under stress rather than fail silently. If collectors experience lag, the message bus buffers incoming events up to its configured retention window (minimum 24 hours). If the buffer approaches its limit, the system applies sampling or topic prioritization, ensuring that security-critical topics such as threat intel matches and high-severity rule alerts are processed before lower-priority telemetry. After any outage, the system backfills from the bus buffer and marks the degraded visibility time window in dashboards so analysts are aware of potential gaps.
- Time Drift Chain: NTP misconfigured at a branch sensor → events arrive with future timestamps → correlation fails → false "rare destination spikes." Handling: health monitor detects drift >200ms; quarantine the sensor's events; force NTP resync; reindex corrected timestamps if stored.
- SPAN Oversubscription Chain: Mirrored 10G link to 1G sensor port → consistent packet drops → TLS metadata gaps → missed C2 beaconing. Handling: drop counter alert triggers; redesign mirror with aggregator or TAP; validate drop rate <1% after fix.
- Identity Mapping Chain: AD log collector failure → user-to-IP mapping stale → lateral movement appears as "unknown host." Handling: cache TTL policy; fallback mapping via VPN/NAC; alert severity reduced but still investigated; restore collector and rebuild mapping timeline.