Installation & Debugging
11.1 Installation Requirements
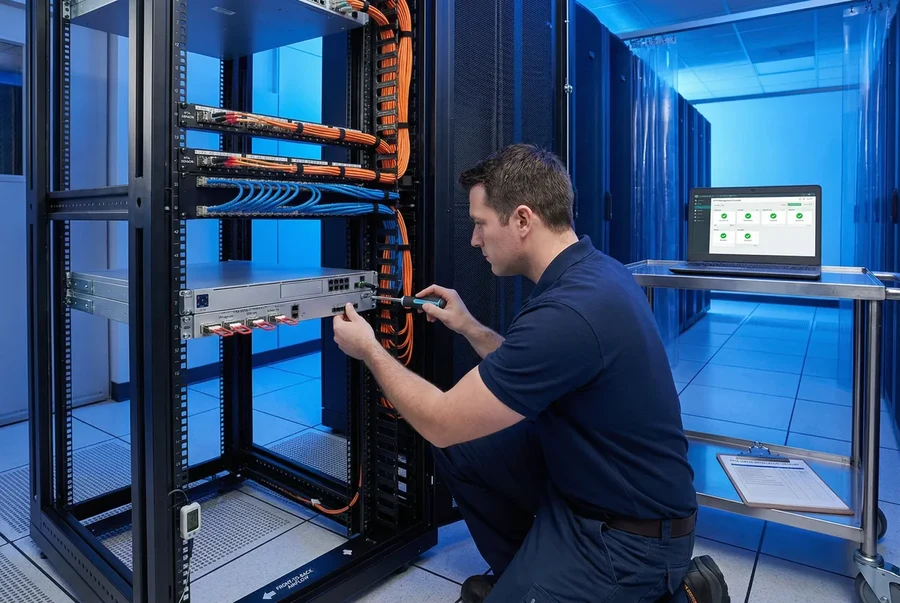
Successful NTA/AD installation requires careful preparation of the physical environment, network infrastructure, and software prerequisites before any hardware is racked. The installation team must verify that all pre-installation requirements are met, that all required accessories and tools are on-site, and that the network change management process has been followed to authorize the TAP insertion and monitoring port configuration changes. The photograph below illustrates a correctly staged installation environment meeting all requirements.
11.2 Pre-Installation Checklist
The pre-installation checklist must be completed and signed off before the installation team begins physical rack work. Items marked as critical must be resolved before installation proceeds; items marked as recommended should be addressed but may be deferred with documented risk acceptance.
| Category | Requirement | Priority | Verification Method |
|---|---|---|---|
| Physical Environment | |||
| Rack Space | Minimum 2U free space available in target rack, with 1U clearance above and below | Critical | Physical rack survey |
| Power | Two independent PDU circuits available, each rated ≥ 20A at 120/240V | Critical | PDU capacity report |
| Cooling | Rack inlet temperature ≤ 25°C, hot/cold aisle containment in place | Critical | Temperature sensor reading |
| Cable Paths | Fiber and copper cable paths identified and cleared, cable lengths measured | Recommended | Cable path walk-through |
| Network Infrastructure | |||
| TAP Placement | TAP insertion points identified, change management ticket approved | Critical | Change management system |
| OOB Management | OOB management switch port available, VLAN configured, IP address allocated | Critical | Network management system |
| DNS/NTP | DNS resolution working from OOB network, NTP server reachable | Critical | nslookup + ntpdate test |
| SIEM Connectivity | Network path from NTA sensor to SIEM verified, firewall rules approved | Recommended | telnet/nc port test |
| Software and Licensing | |||
| License Keys | All license keys received and validated against hardware serial numbers | Critical | License portal verification |
| Firmware Version | Latest stable firmware downloaded and verified (SHA256 checksum) | Recommended | Checksum verification |
| TI Feed Credentials | Threat intelligence feed API keys and TAXII server credentials available | Recommended | API key test query |
11.3 Step-by-Step Installation Procedure
The installation procedure must be followed in the sequence specified below. Each step must be completed and verified before proceeding to the next. Any deviation from the procedure must be documented and reviewed by the lead installation engineer.
- Rack Hardware Installation: Install rack rails per the rail kit instructions. Verify rail depth matches rack depth. Slide the NTA appliance onto the rails and secure with rack screws (4 screws minimum). Install cable management arm and verify it moves freely with the appliance extended.
- Power Connection: Connect PSU-A to PDU-A and PSU-B to PDU-B. Power on the appliance and verify both PSU LEDs are solid green. Check POST completion via the front panel LCD or serial console.
- Transceiver Installation: Insert SFP+/QSFP28 transceivers into all required monitoring ports. Verify each transceiver is fully seated (audible click). Do not connect fiber cables yet.
- Management Network Connection: Connect the OOB management port to the OOB management switch. Verify link LED illuminates. Configure initial IP address via serial console using the NTA-Deploy CLI.
- Initial Software Configuration: Log in to the management console via SSH. Apply license keys. Configure hostname, DNS, NTP, and time zone. Verify NTP synchronization (stratum ≤ 3).
- TAP Installation: Insert network TAPs at the designated monitoring points. Verify TAP bypass relay operation (if applicable). Connect TAP monitor ports to NTA sensor monitoring ports using pre-labeled fiber cables.
- Monitoring Port Verification: Verify all monitoring port links are up and traffic is being received. Check interface counters for Rx packet rate matching expected traffic volume. Verify no Rx/Tx errors.
- Detection Configuration: Import detection rule sets and threat intelligence feeds. Configure baseline learning period (recommended: 7–14 days). Enable alert forwarding to SIEM.
- Integration Testing: Execute the software acceptance test suite (Section 10.3). Verify SIEM alert delivery. Verify TI feed IoC matching. Document all test results.
- Documentation and Handover: Complete the as-built documentation including cable labels, port assignments, IP addresses, and configuration snapshots. Conduct knowledge transfer session with the customer's operations team.
11.4 Common Installation Issues and Debugging
The following table documents the most frequently encountered installation issues, their root causes, and the recommended resolution procedures. Engineers should consult this table before escalating to technical support.
| Symptom | Likely Root Cause | Diagnostic Command | Resolution |
|---|---|---|---|
| Monitoring port shows no link | Transceiver not fully seated; fiber not connected; TAP not powered | show interface eth1 transceiver |
Re-seat transceiver; check fiber connection; verify TAP power |
| Rx power out of range | Fiber bend radius too tight; dirty connector; wrong transceiver type | show interface eth1 ddm |
Inspect fiber path; clean connectors with IEC 61300-3-35 kit; verify transceiver compatibility |
| No traffic visible on monitoring port | TAP not passing traffic; SPAN port not configured; wrong TAP port connected | tcpdump -i eth1 -c 100 |
Verify TAP monitor port vs. network port connections; check SPAN session configuration |
| High packet drop rate | Traffic exceeds sensor rated throughput; CPU overloaded; NIC ring buffer overflow | show system performance |
Enable capture filters to reduce load; upgrade to higher-capacity sensor; tune NIC ring buffer size |
| NTP not synchronizing | NTP server unreachable from OOB network; firewall blocking UDP 123 | ntpq -p; ntpdate -d <ntp-server> |
Verify firewall rules for UDP 123; check OOB network routing; use local NTP server |
| SIEM alerts not received | Firewall blocking syslog port; wrong SIEM IP/port configured; TLS certificate error | nc -zv <siem-ip> 514 |
Verify firewall rules; check SIEM configuration; validate TLS certificate chain |
| License activation fails | Hardware serial number mismatch; license server unreachable; expired trial license | show license status |
Verify serial number matches license; check internet connectivity for online activation; contact vendor support |