Architecture Design
4.1 Architecture Design Principles
A well-designed NTA/AD architecture must balance comprehensive visibility against operational complexity and cost. The fundamental principle is to achieve maximum threat detection coverage with the minimum number of observation points, by strategically placing sensors at network choke points where all relevant traffic must pass. The architecture must be designed to be resilient — sensor failures must not create gaps in detection coverage — and scalable, so that additional observation points can be added as the network grows without requiring a redesign of the analytics platform.
Three core architectural patterns are commonly deployed: the centralized architecture, where all sensors forward telemetry to a single analytics platform; the distributed architecture, where regional analytics nodes process local traffic and forward only alerts and metadata to a central platform; and the hybrid architecture, which combines both approaches. The selection among these patterns depends on network topology, available bandwidth between sites, data sovereignty requirements, and the organization's operational model.
| Architecture Pattern | Best For | Bandwidth Requirement | Latency | Complexity |
|---|---|---|---|---|
| Centralized | Single-site or small multi-site | High (all flows to center) | Low (single platform) | Low |
| Distributed | Large multi-site, data sovereignty | Low (alerts only to center) | Higher (multi-hop) | High |
| Hybrid | Enterprise with regional offices | Medium (metadata + alerts) | Medium | Medium |
| Cloud-Native | Cloud-first organizations | Variable (API-based) | Variable | Medium |
4.2 Typical System Topology
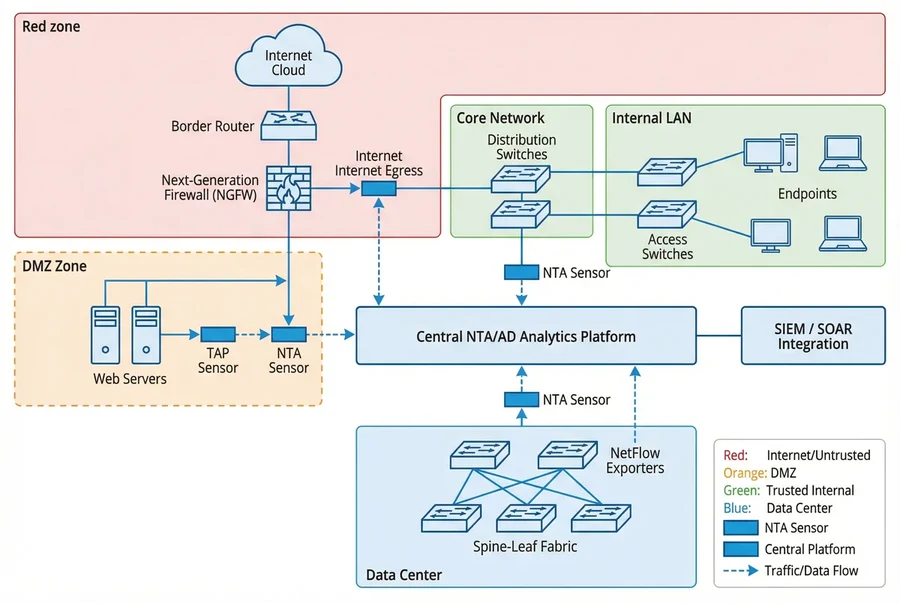
The diagram below illustrates the reference topology for a comprehensive enterprise NTA/AD deployment. The architecture spans four network zones — Internet/Untrusted, DMZ, Core Network/Internal LAN, and Data Center — with NTA sensors positioned at each zone boundary. The central analytics platform receives telemetry from all sensors and integrates with downstream SIEM and SOAR platforms for alert management and automated response.
4.2.1 Observation Point Strategy
The observation point strategy defines where sensors are placed and what telemetry they collect. The strategy must ensure that no significant traffic flow can occur without being observed by at least one sensor. The following observation points are mandatory in the reference architecture:
- Internet egress point: TAP-based packet sensor for full metadata extraction, TLS fingerprinting, and DNS analysis
- DMZ boundary: Packet sensor for full PCAP capability on externally-accessible service segments
- Data center aggregation: NetFlow/IPFIX collection from spine-leaf fabric for east-west traffic visibility
- Core distribution: Flow collection from distribution switches for internal LAN visibility
- Remote sites: Flow export from SD-WAN appliances and branch routers
4.3 Device Connection and Wiring Diagram
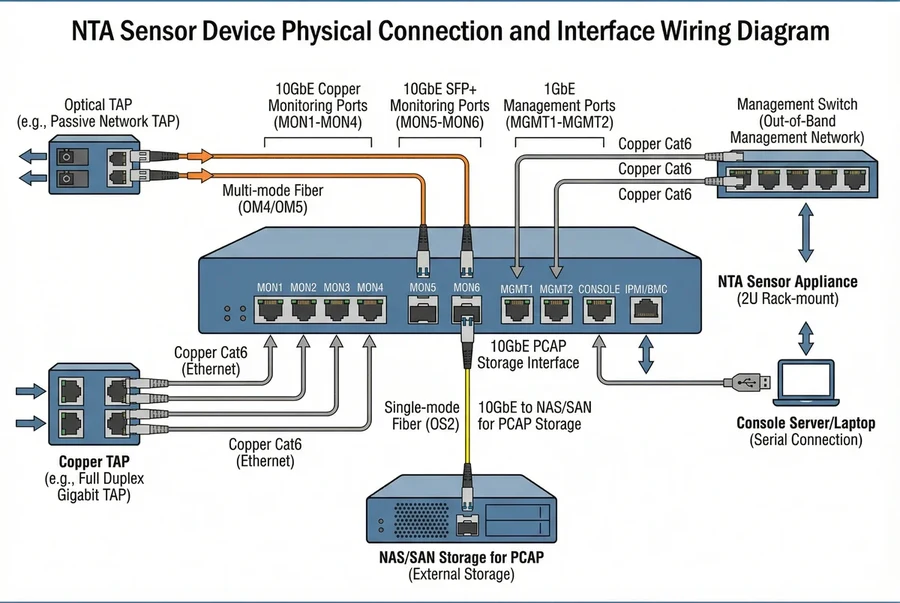
Physical connectivity is a critical aspect of NTA sensor deployment. The diagram below shows the standard interface wiring for a 2U rack-mount NTA sensor appliance, including monitoring port connections to network TAPs, management port connections to the out-of-band management network, and storage interface connections for PCAP data. Understanding the physical connectivity requirements is essential for rack planning, cable management, and ensuring that monitoring connections are passive and non-disruptive to production traffic.
4.3.1 TAP Selection and Placement
Network TAPs (Test Access Points) are the preferred method for connecting NTA sensors to production network links, as they provide a completely passive copy of traffic without introducing any latency or failure risk to the monitored link. The selection between optical TAPs and copper TAPs depends on the physical media of the monitored link. Optical TAPs use passive optical splitting to provide a copy of the light signal, requiring no power to operate. Copper TAPs use active electronics to regenerate the electrical signal, requiring power but supporting full-duplex monitoring on copper links.
| TAP Type | Media | Power Required | Fail-Safe | Max Speed | Use Case |
|---|---|---|---|---|---|
| Passive Optical TAP | Single-mode / Multi-mode fiber | No | Yes (passive) | 100 Gbps+ | Data center fiber links |
| Active Copper TAP | Cat5e/Cat6/Cat6A copper | Yes | Bypass relay | 10 Gbps | Access layer copper links |
| Regeneration TAP | Fiber or copper | Yes | Bypass relay | 40 Gbps | High-fan-out monitoring |
| Aggregation TAP | Mixed | Yes | Bypass relay | 40 Gbps | Combining multiple links to one sensor |
4.4 High Availability Architecture
Production NTA/AD deployments require high availability to ensure continuous monitoring coverage. The HA architecture addresses three failure scenarios: sensor failure, analytics platform failure, and network path failure. Sensor redundancy is achieved by deploying paired sensors on each monitored link segment, with automatic failover. Analytics platform HA uses active-active clustering for the analytics engine and replicated storage for flow metadata and PCAP data. Network path redundancy ensures that TAP failures do not create monitoring blind spots.
| Component | HA Method | Failover Time | Data Loss | Notes |
|---|---|---|---|---|
| NTA Sensor | Active-passive pair | < 30 seconds | Minimal (in-flight flows) | TAP with bypass relay |
| Analytics Platform | Active-active cluster | Transparent | None | Load-balanced ingestion |
| Flow Storage | RAID + replication | Transparent | None | RPO = 0, RTO < 1 min |
| PCAP Storage | RAID 6 or erasure coding | Transparent | None | Tolerates 2 drive failures |